|
A Question Regarding ‘Historic’ Land Reforms in Kashmir
in Early post-1947 Years
Sandeep Banerjee
Recently economist Jean Dreze told, “There were radical land reforms in Kashmir in 1950s and those land reforms were made possible due to Article-370.” [https://www.nationalheraldindia.com/india/economist-jean-dreze-jandk-more-developed-than-gujarat-special-status-helped-reducing-poverty] It is really so because without Article 370 the then Chief Minister Sheikh Abdullah could not expropriate big landlords without compensation. We know that happened from a 1953 article by Daniel Thorner, ‘The Kashmir Land Reforms Some Personal Impressions’ (EPW Sept 12, 1953).
But the Land Distribution Statistics given at the Economic Survey J&K 2013-14 by Government of Jammu & Kashmir, Directorate of Economics & Statistics, J&K (see page 196) shows an altogether different picture. The data given are from Agricultural Census J&K State 2005-06 (with necessary calculations done by the present author.)
Category |
No. of Holdings (000) |
% of Holdings |
Area Operated Ha (000) |
% of Area |
Average Size Ha |
Marginal |
1122.97 |
81.6224624 |
406 |
44.03471 |
0.36 |
Small |
167.17 |
12.15066034 |
237 |
25.70499 |
1.40 |
Semi-medium |
71.40 |
5.189670085 |
193 |
20.93275 |
2.70 |
Medium |
13.65 |
0.99214281 |
74 |
8.02603 |
5.42 |
Large |
0.62 |
0.045064362 |
12 |
1.301518 |
19.35 |
From here we can get the following, from which an approximate Lorentz Curve could be drawn and Gini Co-efficient [1] (for inequality) could be guessed.
% Holding |
Cum % Holding |
% Area |
Cum % Area |
0 |
0 |
0 |
0 |
81.622 |
81.622 |
44.035 |
44.035 |
12.151 |
93.773 |
25.705 |
69.74 |
5.19 |
98.863 |
20.932 |
90.672 |
0.992 |
99.855 |
8.026 |
98.698 |
0.045 |
100 |
1.302 |
100 |
The Gini Co-efficient is 0.74771 which indicates a grave inequality with respect to land holdings. The corresponding Lorentz Curve is here.
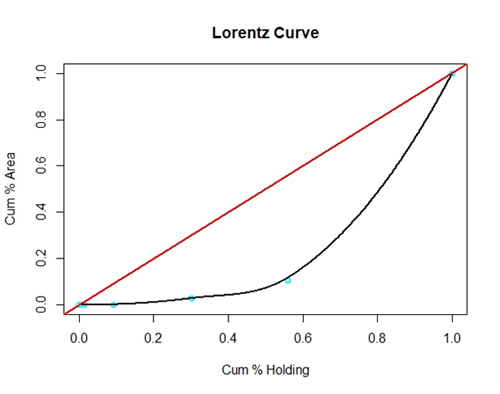
[By the way, in the above curve plotted by R [2] shows cumulative % holding or cumulative % area as, for example, 80% = 80/100 = 0.8; the Red curve is the equality line and the black curve is the Lorentz curve of land distribution in J&K as per 2005-06 agri. census data.]
Now, the question is — how could a successful ‘radical’ land distribution give rise to inequality like this? An easy answer is unbridled capitalist development (and not following the path envisaged by National Conference in pre-independence days like expropriation of landlords without compensation, giving land to the tillers, forming agricultural cooperatives and then going to more socialised production) in the later period gave rise to this inequality. But this transition, if it is real, need more explanation of different stages in the agrarian history of J&K of last 70-75 years which the present author is unable to deal with having no knowledge regarding this.
Only one point can be highlighted from the said essay of Daniel Thorner – the last paragraph from the conclusion part. “For their total effect the Kashmir land reforms have to be examined and assessed in the light of the day to-day functioning of village life. Mere statistics of so and so many hundred thousand acres taken away from the big landlords can be quite misleading. India's most-publicized land reforms cannot be said to have Succeeded in improving the economic: lot of the Kashmiri peasant. Whether the legislation was well conceived for this purpose remains debatable. In practice any beneficial results have been more than balanced by the Government's food procurement polity, the co-operatives' reign of extortion, the implementation of redistribution through the old bureaucracy, and the sole political party's setting itself up as yet another privileged rural hierarchy.”
Notes:
1. Gini Coefficient
Gini Coefficient is a popular statistical measure to gauge the rich-poor income or wealth divide. It measures inequality of a distribution — be it of income or wealth — within nations or States. Its value varies anywhere from zero to 1; zero indicating perfect equality and one indicating the perfect inequality. Gini Coefficients can be used to compare income distribution of a country over time as well. An increasing trend indicates that income inequality is rising independent of absolute incomes.
There are many ways to measure it. Two popular ways are those based on pre-tax (or market) income and disposable income. The latter considers taxes as well as social spend before arriving at the figure. So, in a sense, the difference between the two kinds of measures indicates the efficacy of a country’s fiscal policy in reducing the rich-poor divide through taxation and social spends. Chancel and Piketty’s report has used the pre-tax method of calculating the Gini Coefficient.
2. Calculations in R
library(ineq)
holding <- c(0,81.622,12.151,5.19,0.992,0.045);
area <- c(0,44.035,25.705,20.932,8.026,1.302);
Lc.p <- Lc(holding,n=area)
x<- Lc.p$p;
y<-Lc.p$L;
lo <- loess(y~x)
plot(x,y, main = "Lorentz Curve", xlab = "Cum % Holding",ylab = "Cum % Area")
lines(x,y,col = 5, lwd = 2, type = "p")
xl <- seq(min(x),max(x), (max(x) - min(x))/1000)
lines(xl, predict(lo,xl), col='black', lwd=2)
abline(c(min(x), min(y)), c(max(x),max(y)),lwd=2, col="RED")
print("the gini coefficiect is")
print(ineq(holding,type="Gini"))
Frontier
Sep 5, 2018
Sandeep Banerjee sandeepbanerjee00@gmail.com
Your Comment if any
|